

The bear market from an historical context and the potential impact of lower interest rates in Australia
Key points
- Shares are still in a bear market, but if history is any guide the bulk of the damage is behind us.
- While it may take a while for shares to regain previous highs, history tells us that the first 12 months of recovery will see strong gains.
- The falling oil price and some signs of more relaxed central banks, including the Reserve Bank of Australia (RBA), are positive for shares.
Introduction
It is now a year since the US sub-prime mortgage crisis really hit with a vengeance. Shares have recently made new lows, indicating the ride remains harrowing for investors. This note reviews how the current bear market compares to past bear markets and examines the implications for Australian shares of likely RBA rate cuts.
Still a bear market
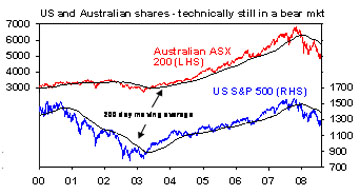
Share markets in the US, Australia and elsewhere are still tracing out a classic bear market pattern of falling lows and falling highs. The 200-day trailing moving average of share prices, which is a good guide to the trend, is continuing to fall. The rally into May proved to be a classic bear market rally with shares rallying up to around their 200-day moving average before commencing their most recent descent. This contrasts with bull markets where there is a pattern of rising highs and lows and where corrections generally see shares move back to their trailing moving average after which they rebound.
Source: Bloomberg, AMP Capital Investors
Putting the bear market in perspective
There is no agreed definition of a correction versus a bear market. Some people focus on the magical 20% fall as a demarcation but this measure seems rather arbitrary. My view is that a correction is limited to sharp falls, across a few months, after which the rising trend in share prices resumes, taking shares back to new highs within about six months of the low. By contrast, a bear market sees falls lasting many months or years and it takes shares a year or more to regain new highs. The next two tables show bear markets since 1960 for US and Australian shares.
Bear markets in US shares since 1960
|
Share bear market in US shares |
Mths to low
|
% fall |
Mths after low to make new high |
% gain in first 12 mths after low |
|
Aug 59-Oct 60 |
14 |
-13.9 |
3 |
+5 |
|
Dec 61-Jun 62 |
6 |
-28.0 |
15 |
+33 |
|
Feb 66-Oct 66 |
8 |
-22.2 |
6 |
+33 |
|
Nov 68-May 70 |
18 |
-36.1 |
22 |
+37 |
|
Jan 73-Oct 74 |
21 |
-48.2 |
69 |
+38 |
|
Nov 80-Aug 82 |
21 |
-27.1 |
3 |
+58 |
|
Aug 87-Dec 87 |
4 |
-33.5 |
19 |
+23 |
|
Mar 00-Oct 02 |
31 |
-49.1 |
55 |
+34 |
|
Average |
15 |
-32 |
24 |
+33 |
|
Oct 07- ? |
10 ? |
-22.4 ? |
? |
? |
Source: Bloomberg, AMP Capital Investors
Bear markets in Australian shares since 1960
|
Share bear market in Aust shares |
Mths to low
|
% fall |
Mths after low to make new high |
% gain in first 12 months after low |
|
Sep 60-Nov 60 |
2 |
-23.2 |
33 |
+12 |
|
Feb 64-Jun 65 |
16 |
-20.4 |
25 |
+9 |
|
Jan 70-Nov 71 |
22 |
-39.0 |
94 |
+52 |
|
Jan 73-Sep 74 |
20 |
-59.3 |
59 |
+51 |
|
Nov 80-Jul 82 |
32 |
-40.6 |
17 |
+39 |
|
Sep 87-Nov 87 |
2 |
-50.1 |
75 |
+35 |
|
Aug 89-Jan 91 |
15 |
-32.4 |
30 |
+39 |
|
Feb 94-Feb 95 |
12 |
-21.7 |
20 |
+25 |
|
Mar 02-Mar 03 |
12 |
-22.3 |
15 |
+27 |
|
Average |
15 |
-34 |
41 |
+32 |
|
Nov 07- ? |
10 ? |
-29.5 ? |
? |
? |
Source: Bloomberg, AMP Capital Investors
Since 1960, the US and Australian share markets have experienced eight and nine bear markets, respectively. The average duration has been 15 months in both markets, with an average top to bottom fall of 32% in the case of US shares and 34% for Australian shares. The average time taken to regain the previous share market peak is 24 months in the US and 41 months in Australia. Most bear markets are associated with a recession, although in terms of the Australian share market, this may only relate to a US recession (such as earlier this decade). The average rebound in the first 12 months after the low is 33% in US shares and 32% in Australian shares.
There are several points to note about this. First, as with most bear markets associated with a recession, the falls in share markets that we have seen suggest that the risk of an ‘official’ recession is high, both in the US and Australia.
Second, there is good reason to believe the bulk of the damage is behind us. US shares have fallen 22% versus their average bear market decline of 32% and Australian shares have fallen nearly 30% compared to their average bear market fall of 34%. Of course, these averages mask a wide divergence with the mid 1970s bear market, which occurred at a time of severe economic problems (i.e. double digit inflation and recession), the 1987 crash and the tech wreck. Given that a re-run of the 1970s economic shock is unlikely, and that we didn’t see the sort of share market overvaluation that preceded the 1987 crash or tech wreck, there is good reason to see shares falling by less than their bear averages this time.
Third, while history suggests that it may take some time to regain previous highs, it is worth noting that once shares bottom, the rebound in the first 12 months is usually very strong with an average gain of 33% in US shares and 32% in Australian shares. Given that the rebound normally occurs against a backdrop of extreme uncertainty (with shares climbing the classic ‘wall of worry’), the obvious risk for investors switching to cash (in the hope of getting back in when the outlook is clearer) is that they miss out on the best part of the rebound.
What are the implications of likely rate cuts in Australia?
The slump in the Australian economy and recent indications from the RBA suggest that local interest rates will start falling soon, possibly as early as next month. Falling interest rates are normally good for shares. They help future profit growth and make shares relatively more attractive than cash. Hence, they are usually associated with higher price-to-earnings (PE) multiples. The table below shows the Australian share market’s response after the first rate cut at the start of an easing cycle.
Australian equity performance (ASX 200), % change, months after first RBA rate cut in an easing cycle
|
First rate cut |
+3mths |
+6mths |
+12mths |
|
May 82 |
-7.6 |
1.0 |
19.8 |
|
Jan 86 |
12.7 |
17.6 |
45.7 |
|
Jan 90 |
-10.9 |
-3.8 |
-23.9 |
|
July 96 |
6.5 |
11.1 |
23.4 |
|
Feb 01 |
0.5 |
2.6 |
3.8 |
|
Average |
0.2 |
5.7 |
13.8 |
Source: Thomson Financial, AMP Capital Investors
On average, shares are up three, six and 12 months after the start of an Australian rate cut cycle. As can be seen in the table above though, the experience is mixed in periods of recession/hard landing. However, as Australian shares have already fallen sharply and are looking very cheap with strong resource sector profits likely to underpin overall profit levels, there is good reason to believe that shares will be up on a 12-month horizon.
One point worth noting though is that commodity prices, notably energy, recently rose to a level that was starting to choke off global growth and they are now undergoing a correction. While this does not mean the end of the long-term upswing in commodity prices (as the long-term China story remains alive and well and supply is likely to remain constrained), the commodity correction is likely to have further to go in the short term. This is likely to mean that resources will be relative underperformers for a few months, and given the relative importance of resources in the Australian share market, this will likely mean that Australian shares may underperform global share markets for a while. Asian shares are likely to be key beneficiaries of the correction in commodity prices given their high reliance on commodity imports.
Signs to watch for a sustainable share rebound
We are looking for the following signposts to be confident that share markets are on track for a sustainable rebound:
- A sharp and sustained fall in the oil price;
- A fall in inflation worries as reflected in bond yields;
- A relaxation in central bank hawkishness;
- A slowing in US house price falls; and
- A sustained improvement in credit markets.
There is still little clear improvement in credit markets. But it is interesting that some of these signposts may be starting to fall into place. The oil price is down substantially from its high. This in turn should help to reduce inflation worries and central bank hawkisness. The Reserve Bank of New Zealand and the RBA may already be showing early warning signs of this turn towards relaxation in central bank hawkishness.
Concluding comments
It appears increasingly as though shares have put in a good low with more upside ahead. Financials, for instance, have rebounded solidly from panic selling in mid-July. Australian shares seem to have found strong support around the 4800 level. This may just be another bear market bounce though and we still see the next few months as being quite rough. However, with the oil price moving in the right direction (with positive implications for inflation and interest rates), there is increasing reason to be confident that shares will rally into year-end.
While the likely shifts to lower interest rates and a softer Australian dollar are good news for Australian shares, they are vulnerable to relative underperformance over the next six months as commodity prices correct further.
Dr Shane Oliver
Head of Investment Strategy and Chief Economist
AMP Capital Investors