

The 1987 crash - what is the risk of a repeat now?
Key points
- This month marks the 20th anniversary of the October 1987 share market crash. While the anniversary itself has the potential to create jitters, the current situation in share markets is very different to that before the 1987 crash. Share price gains and valuations have been far more reasonable this time around.
- While shares are at risk of a correction there is no reason to expect a big slump and our view remains that the trend will remain up.
Introduction
With October 19 marking the 20th anniversary of the October 1987 share market crash, it is reasonable to wonder about the risk of a re-run now. This is particularly the case with shares having had strong gains over the last four and a half years and after the volatility of the last few months. This note provides a comparison between the US and Australian share markets today and in 1987.
1987 – what happened?
From mid 1982 to August/September 1987 global and Australian shares experienced a powerful bull market on the back of recovery from the early 1980s recession, the economic de-regulation and reform of the 1980s and a re-rating of shares after the move to lower inflation. By 1987 this had become very speculative and debt-fuelled. Australian shares nearly doubled over the year to their September 1987 high on the back of strong gains in so-called entrepreneurial stocks. US shares peaked in August 1987 and Australian shares peaked in September. After a gradual drift lower, the US market fell 20% on October 19 which reverberated around the world resulting in a 25% fall in Australian shares on October 20. From their pre-crash highs to late 1987 lows, US shares fell 35% and Australian shares fell 50%. It took the US share market just over two years to rise above its pre-crash highs but Australian shares did not rise above their August 1987 high until February 1994.
The precise causes of the 1987 crash have been subject to much debate. But the key driver appears to have been a combination of a 3% rise in US inflation, a 2 percentage point rise in US bond yields and the US Federal Reserve (Fed) tightening hitting investor confidence at a time when shares were very overvalued after huge gains and investor confidence was unsustainably high.
Comparisons with 1987
The following tables provide a comparison of key indicators for US and Australian shares today with those of 1987.
US shares - now versus 1987
US shares August 1987 peak US shares now Prior 12 month share price gain, % 36.4 15.8 Prior 4 year price gain, % pa 20.3 11.3 Prior 12 month profit growth, % -1.8 14.9 Prior 4 year profit growth, % pa 3.3 17.9 Historic PE, times * 23.2 17.2 - prior 10 year average of PE, times 11.0 23.8 Forward PE, times * 14.9 14.9 - prior 10 year average of forward PE 11.4 18.5 Inflation, % 4.1 2.1 10 year bond yield, % 9.0 4.6 Fwd earnings yield less bond yield, % -2.3 2.1 Dividend yield, % 2.6 1.9 Dividend yield less inflation, % -1.5 -0.2
* The historic price to earnings ratio (PE) is based on reported earnings while the forward PE is based on 12 month ahead consensus earnings expectations. The forward earnings yield is the forward PE inverted. Source: Thomson Financial, AMP Capital Investors
Australian shares - now versus 1987
|
|
Aust shares Sept 1987 peak |
Aust shares now |
|
Prior 12 month share price gain, % |
88.4 |
29.6 |
|
Prior 4 year price gain, % pa |
34.0 |
20.1 |
|
Prior 12 month profit growth, % |
24.5 |
14.7 |
|
Prior 4 year profit growth, % pa |
15.5 |
25.0 |
|
Historic PE, times |
20.4 |
16.2 |
|
- prior 10 year average of PE, times |
11.0 |
20.7 |
|
Forward PE, times |
15.8 |
15.4 |
|
- prior 10 year average of forward PE |
NA |
15.3 |
|
Inflation, % |
8.5 |
2.7 |
|
10 year bond yield, % |
12.5 |
6.2 |
|
Fwd earnings yield less bond yield, % |
-6.2 |
0.3 |
|
Dividend yield, % |
2.5 |
3.6 |
|
Dividend yield less inflation, % |
-6.0 |
0.9 |
Source: Thomson Financial, AMP Capital Investors
Several points stand out:
Firstly, the increase in share prices this time around has been nowhere near comparable to the surge in the 1987 share market top. The gain in the Australian share market over the four years to its September 1987 peak was way above the gain over the last four years. The cyclical bull market from March 2003 has seen Australian shares rise by a total of 149%, which is nothing compared to the 420% rise between the bear market low in July 1982 and the pre-crash high in September 1987.
The next chart compares the current bull market to the 1982 to 1987 bull market. The All Ordinaries price index has been indexed to 100 at its early 1980s cyclical low and to 100 at its low in March 2003 and then the two price lines have been overlaid on each other. The current bull market has been far more modest than that in 1987.
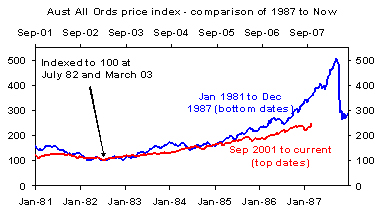
Source: Thomson Financial, AMP Capital Investors
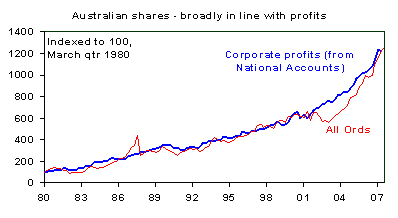
Secondly, share market gains this time around have been less than profit growth. Over the four years to the 1987 peak in both US and Australian shares, share price gains were way in excess of profit growth. By contrast, over the last four years share price gains have lagged profit growth. This is consistent with the chart below, which shows Australian share market gains since 1980 compared to growth in economy-wide profits (as reported to the Tax Office). Prior to the 1987 crash share prices surged relative to profits, whereas in recent years share prices have been catching up to profits after the 2002-03 bear market.
Thirdly, due to the strength in earnings growth valuation measures are far more favourable today:
- The ratio of share prices to reported earnings (historic PE) rose well above its prior ten year average in the case of US and Australian shares in 1987, whereas today the historic PE for US and Australian shares is well below their average of the previous ten years. The same applies to the forward PE for US shares.
- The 1987 bubble was associated with much higher inflation and hence bond yields. One way to allow for this is to compare the earnings yield on shares to the bond yield. In 1987 in both the US and particularly Australia the forward earnings yield on shares was way below the ten year bond yield. This is not the case today. This is evident in the chart below.
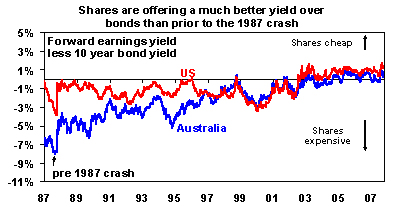
Source: Thomson Financial, AMP Capital Investors
- Another valuation tool is to add inflation to the PE, since lower inflation should result in a higher PE. The higher this is the more the market is overvalued. Today, the sum of inflation plus the PE is way below what it was in 1987 (in Australia’s case using the forward PE it is only 18.1 today versus 24.3 in 1987).
- Similarly, the dividend yield today compares far more favourably than in 1987. The real (i.e., after inflation) dividend yield in Australia is now a positive 0.9%, compared to -6% just prior to the 1987 crash.
Other points worth noting include the following:
- The 1987 share price bubble was associated with rapid growth in corporate debt and gearing, asset churning and highly speculative developments by a group of entrepreneurial stocks (e.g., Bond Corp, Qintex, etc). In fact, the entrepreneurs had their own share market sector. By contrast corporate gearing is now relatively low and the huge profit growth being generated by resources companies is real.
- Prior to the 1987 crash the Fed was raising interest rates, whereas right now it is cutting interest rates.
- Similarly, whereas US inflation was rising prior to the 1987 crash, it is now falling with the Fed’s preferred measure of inflation falling to 1.8% year on year in August from a peak of 2.5% in February this year.
- Finally, it is worth noting that after the 1987 crash circuit breakers were built into the US stock market that close it down for a short period after a certain fall to help calm investors down.
Concluding comments
After rising sharply from their recent lows in August, shares are due for a bit of a pull back and weak US economic data may be a trigger. While the anniversary of the 1987 crash is meaningless from a fundamental point of view it may create a few jitters. (It is interesting to note that in late October 1997 shares had their worst one day fall in the last decade with some citing the anniversary of the 1987 crash - they then quickly bounced back). However, while one can never rule out another crash given the fickleness of investor confidence, the situation today is not comparable to that in 1987. Share price gains have been far more restrained relative to profit growth such that valuations remain reasonable and are a long way away from bubble extremes. As such there is nothing to indicate a major crash or the start of a bear market around the corner.
Dr Shane Oliver
Head of Investment Strategy and Chief Economist
AMP Capital Investors