

What’s driven the recent rally in shares? Is it sustainable?
Key points
- Shares have had strong gains over the last month driven by better than expected economic data and policy stimulus going into overdrive.
- It is too early to say for sure that the share bear market is over. The road will likely remain rough, but there are some positive signs, including evidence that economic stimulus is gaining traction, which may be consistent with a cyclical improvement in shares getting underway.
Introduction
From their early March lows, global and Australian share markets have had gains of 20% or so. In fact, Asian shares are up around 50% from their October low last year. What has driven this and is it sustainable?
It’s been a big bad bear
In terms of bear markets, the current one has been particularly bad. The table below compares top to bottom falls in all bear markets in Australian shares since 1900.
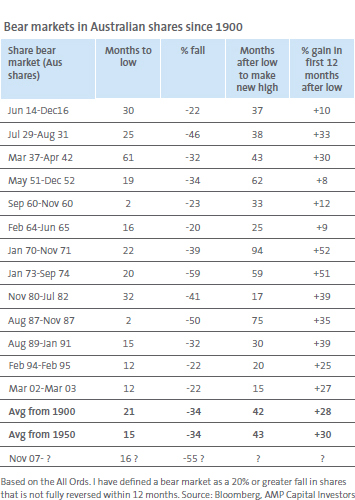
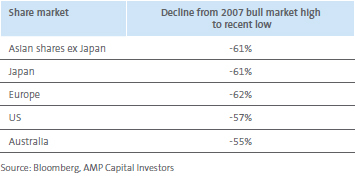
Since 1900, bear markets in Australian shares have lasted an average of 21 months with an average top to bottom fall of 34%. The bear market since 2007 has now gone 16 months but is far worse in magnitude than the average bear market; its 55% top to bottom fall is second only to the 1973-74 bear market which saw shares fall 59%. Interestingly, the top to bottom fall in Australian shares has been slightly less than in most major markets. This appears to reflect the faster and bigger policy response in Australia, the sharp fall in the A$ (which has helped trade-exposed Australian companies) and the better relative functioning of the Australian banking system.
Drivers of the rally from early March
The sharp rally in shares since early March has been ’driven‘ by a combination of factors, including:
- A series of better than expected economic data, ranging US and Chinese business conditions to Australian housing finance to UK mortgage approvals
- Policy stimulus going into overdrive with near zero interest rates and quantitative easing in several countries, massive fiscal stimulus packages, firmer moves to buy toxic debt in the US, increased IMF funding and a G20 commitment in favour of free trade
- The relaxation of US ‘mark-to-market’ accounting regulations essentially allowing the valuation of assets at prices consistent with an orderly sale, rather than fire sale prices.
Is it sustainable?
Bear markets often have good countertrend rallies and this may be just one of them. For example, in the 1929 to 1932 bear market, US shares fell 86% over nearly three years but there were six rallies along the way ranging between 13% and 47%. Ignoring the latest rally, since peaking in October 2007, US shares have had two rallies, ranging from 12% to 24% and Australian shares have had two rallies ranging from 12% to 17%. While the latest rally has been the strongest in the bear market so far, there is good reason to suspect that the latest rally is just another bear market bounce given ongoing bank problems and the worst global recession in over 70 years. That said, there are several reasons for cautious optimism.
First, investor sentiment reached levels of bearishness normally associated with major bear market bottoms. For example, at the low four weeks ago, a record 70% of surveyed individual investors described themselves as bearish. Despite the rally from early March, investor sentiment remains bearish and the consensus is that it has just been another bear market rally. This is a positive sign from a contrarian perspective.
Second, shares remain very cheap from a long-term perspective offering much higher cash flow yields than cash or bonds.
Finally, and most importantly, the global policy response to the crisis appears to be gaining some traction:
- Money market lending spreads have returned to levels seen prior to Lehman Brothers’ collapse in September and credit spreads have stabilised.
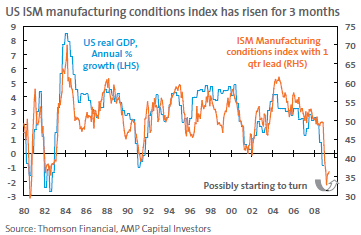
- Business conditions indicators globally seem to be stabilising and are improving in some cases. This is clear in the ISM survey of US manufacturing conditions which is now up for 3 consecutive months.
- Housing related indicators for sales and finance in the US and UK are showing some signs of bottoming.
- Chinese exports and industrial production remain weak, however business conditions surveys have improved, as have data for loan growth, fixed asset investment, retail sales, car sales and electricity production.
- In Australia, lower interest rates and stimulus payments to households appear to be stabilising consumer sentiment and retail spending and boosting some housing indicators.
- Various other financial markets have confirmed the rally in shares since early March with commodity prices breaking higher, growth-oriented currencies such as the A$ on the rise and so-called ’safe-haven‘ currencies such as the yen and US$ weakening. Bond yields have also stopped falling.
In terms of growth-related indicators, it appears as though the world is going through an inflection point with the rate of decline moderating. This is consistent with growth starting to improve from later this year or through 2010. The key direction-setting US share market normally leads the trough in economic activity by about six months. If these indicators are right in pointing to improved economic conditions from later this year, this would be consistent with shares bottoming in the first half of the year.
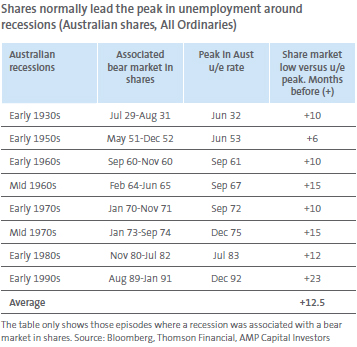
While labour market indicators are still deteriorating rapidly and likely have much further to go (US unemployment is likely to peak around 11% and Australian unemployment is likely to peak around 9%), it notable that unemployment is a lagging indicator. In Australia, the average lag from a bottom in shares following a bear market to a peak in the unemployment rate is twelve and a half months.
But expect a bumpy ride
There is good reason to expect that the rally in shares has further to go and there is a reasonable chance that we may have seen the lows. However, the ride is likely to be bumpy. Problems in the banking sector remain immense; the recession is still with us and is severe, even if the rate of deterioration is slowing; house prices have more downside in the US, Europe and Australia; and further earnings downgrades are likely. In particular:
- After 20% or so gains over four weeks, shares are due for a bit of a pause and this now seems to be underway.
- After rallying into mid-year, shares are likely to experience their normal seasonal weakness in the September quarter.
To be more confident that we have entered a new cyclical upswing in shares, we would look for any pullbacks in shares to bottom above their March lows, credit spreads to narrow further, the decline in US house prices to slow, US efforts to remove toxic debts from banks to be successful, and business and consumer confidence to trend higher.
Finally, while the cyclical outlook for shares looks slightly more promising, medium-term economic growth in traditional developed equity markets will be constrained by the unwinding of high debt levels (which may take years to unfold); tighter credit conditions in the long term; the need to unwind budget deficits once recovery occurs; and the increasing role of government in the economy. This is a separate topic but highlights the relative attractiveness of Asian and other emerging markets which are not constrained by high debt levels and these trends.
Dr Shane Oliver
Head of Investment Strategy and Chief Economist
AMP Capital Investors