

Falling debt and rising savings – how big a problem?
Key points
- Household savings rates are set to move higher in the years ahead as households seek to cut debt in the face of reduced credit availability, economic uncertainty and a loss of wealth.
- Lower interest rates and government measures to boost household finances should help ease this adjustment, heading off the economic calamity that some predict.
Introduction
A key determinant of the severity of the recession both globally and in Australia will be the extent and speed with which households boost their savings to cut their debt levels. This is commonly referred to as ‘de-leveraging’. Currently, economic pessimists tend to think that all or much of the surge in household debt over the last 20 years will need to be unwound, requiring a massive fall in consumer spending which will put us into a severe recession if not depression. Alternatively, the relative optimists agree debt will be unwound to some degree but think that it can be cushioned by lower interest rates and increased government spending and tax cuts.
The post 1980 savings slump and debt surge
There is good reason to be concerned about the impact of ‘de-leveraging’. The past thirty years have seen a massive rise in household debt relative to income, particularly in Anglo countries. In Australia, the ratio of total household debt to total household disposable income in the economy has gone from 38% in 1980 to 160%. See the chart below.
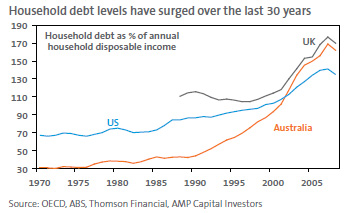
This went hand in hand with a fall in household saving rates from around 10% of household disposable income prior to 1980 to around zero in both the US and Australia.
Pressure on savings to rise and debt to fall
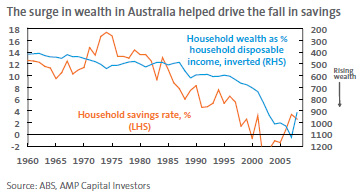
The rise in debt and fall in savings over the past few decades reflects a range of factors including: the increasingly easy availability of credit following financial market de-regulation in the 1980s; falling interest rates which made debt more affordable; younger generations becoming more comfortable with debt as memories of war and serious economic problems faded; and rapidly rising wealth levels which reduced the need to save (as indicated in the chart below) and supported a higher level of debt.
The trouble is most of these factors are now in reverse.
- The implosion in global credit markets is reducing the supply of credit to households. This is forcing tighter credit standards, pushing financing back via the banks who have stricter lending standards even in normal times and reducing competition amongst lenders. Increased regulation will act to ensure tighter credit conditions longer term. The end result from the global financial crisis is likely to be a much tighter lending environment for five to 10 years to come.
- The recession and rising unemployment will make the current generation of borrowers far more aware of the downside of having ‘too much’ debt and of not saving much. This is likely to see a big reduction in the level of debt most borrowers are comfortable with and a more positive attitude towards saving.
- There has been a big fall in wealth levels. Household wealth is down about 20% in the US and by about 10% in Australia from 2007 highs. Further falls in house prices will add to the wealth loss in Australia. This will have two effects. Firstly, the fall in asset values reduces the level of debt people are comfortable with. Secondly, it reduces the level of savings for retirement which may force baby boomers who are getting close to retirement to save more out of their current income to make up the gap. So, just as the rise in wealth was associated with a fall in savings the fall in wealth will likely boost savings.
Household debt levels are already falling in the US and UK thanks to defaults and write-offs, reduced credit supply and less interest in borrowing. Growth in household debt in Australia has slowed to a crawl. But all of these considerations suggest the downwards pressure on debt levels is likely to intensify. But by how much? Some argue that household debt ratios need to fall back to early 1990s levels. For example, to unwind the surge in the US household debt to income ratio back to 1990 levels would require a US$5 trillion reduction in the level of debt, equal to 37% of US gross domestic product (GDP). And if the Australian household debt to income ratio were to be wound back to 1990 levels this would require a A$780 billion debt reduction, which is about 65% of annual GDP. If this were to be achieved quickly it would trigger a massive collapse in economic activity. However, this approach seems rather arbitrary and extreme. Why should debt to income ratios fall back to 1990 levels? Why not 2000 levels? A simpler approach is to focus on the saving rate, since it will largely be by saving more that debt will be reduced. A likely outcome from the current turmoil and the increased pressure and desire to reduce debt and boost savings is that the household saving ratio will revert to its pre-financial deregulation era level of around 10% in the US and Australia.
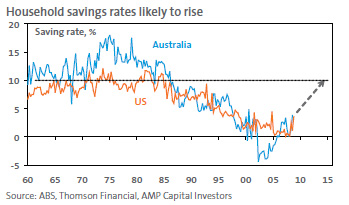
From current levels for the saving ratio of around 4% in the US and Australia this would amount to US$700 billion being wiped off consumer spending in the US or 5% of GDP and A$45 billion or 4% of GDP in Australia. Such a scenario would also have major multiplier effects for overall economic activity – business investment in response to reduced consumer spending which would compound the slump in economic activity. And there could be a severe feedback loop – what is often referred to as a ‘debt-deflation spiral’ as falls in spending lead to higher unemployment, forcing more sales of shares, houses and other assets leading to further falls in their prices. This all leads to even greater pressure to reduce debt and boost savings. This is pretty much what happened in the Great Depression of the 1930s.
But there is no right level of debt and government action will slow the adjustment
However, there are several points worth noting. Firstly, while a reduction in debt levels seems likely there is no right level of debt and savings. Debt to income ratios have been rising since debt was first discovered. In fact, it makes sense that the ratio of debt to income rises over the long term because as incomes rise relative to spending on necessities there is a greater ability to service debt. The fallacy of trying to pick the right level for debt is highlighted by the following quote from Fortune Magazine: “Consumer debt is approaching a historical turning point. Having risen at an abnormally fast rate for ten years, it must soon adjust itself to the nation’s capacity for going into hock… which is not limitless. Whether the rate of growth in consumer debt will slow down is no longer the question…it must slow down.”
Sound familiar? The trouble is that the quote was made way back in 1956 when US household debt was 34% of GDP – it is now about 100%.
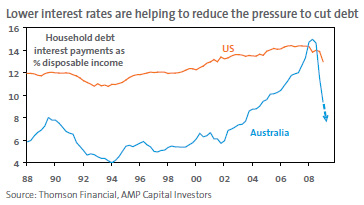
Secondly, lower interest rates will ease the pressure on households to cut their debt levels by cutting debt serving costs and will at least slow the adjustment to a higher savings rate. After this week’s interest rate cut in Australia, the proportion of total household disposable income being used to pay interest will have fallen to below 10%, well down from its peak of 15%. If, as we expect, the cash rate is cut by another 1%, the interest servicing ratio will fall back into the range that prevailed in the 1990s. On a $300,000 mortgage the annual interest bill has already fallen by $11,400 and with interest rates likely to fall another 1%, this will bring the saving to $14,400. This can be used to rapidly cut the size of the mortgage.
Of course, lower interest rates won’t completely offset the impact of both rising unemployment and falling wealth in driving a desire to boost savings. Thirdly, fiscal policy can play a big role in smoothing the adjustment to reduced debt levels and higher saving rates. Firstly, tax cuts and one off payments to households can help households reduce their debt levels and boost savings and in the process help reduce the cutback in consumer spending that would otherwise have occurred. Secondly, governments can increase their spending to fill the gap left by the decrease in private spending (and finance this by increasing the budget deficit by the same amount that private borrowing is cut). It’s worth noting that the Australian Government’s latest A$42 billion stimulus plan roughly matches the possible cut to consumer spending referred to earlier, as does the Obama Administration’s US$800 billion package.
Concluding comments
We are likely to see a significant increase in household savings going forward in response to a much tighter lending environment, rising unemployment and increased economic uncertainty and the resulting lower debt comfort levels and slump in wealth. However, the size and speed of the increase and the resultant reduction in consumer spending will be reduced by lower interest rates, government payments to households and increased government borrowing. This should help head off the depression scenarios that some are now promoting. But a fall in debt and rise in savings rates is nevertheless likely to be a major theme over the years ahead.
Dr Shane Oliver
Head of Investment Strategy and Chief Economist
AMP Capital Investors
Important note: While every care has been taken in the preparation of this document, AMP Capital Investors Limited (ABN 59 001 777 591) (AFSL 232497) makes no representation or warranty as to the accuracy or completeness of any statement in it including, without limitation, any forecasts. Past performance is not a reliable indicator of future performance. This document has been prepared for the purpose of providing general information, without taking account of any particular investor’s objectives, financial situation or needs. An investor should, before making any investment decisions, consider the appropriateness of the information in this document, and seek professional advice, having regard to the investor’s objectives, financial situation and needs. This document is solely for the use of the party to whom it is provided.