

The continuing roller-coaster ride in financial markets
Key points
- Shares have made new lows in the past week on more bank failures and uncertainty about the US Government’s relief package.
- Successful approval and implementation of the US debt relief package should head off a worst case economic slump, but won’t stop recession in the short term.
- So the ride for shares is likely to remain rough in the short term, but they are good value on a one year view.
- The ongoing turmoil and recessionary conditions in the developed world highlight the need for much lower interest rates globally, including in Australia and Asia.
Introduction
The credit crunch and global share markets have taken another turn for the worst this week. This reflects a combination of the US House of Representatives’ initial rejection of the debt relief package and continuing bank failures/rescues in the US and Europe. Uncertainty regarding the investment outlook is continuing to drive massive daily swings in share markets. Over the last twenty trading days the Australian share market has seen 17 days where the market has moved by 1% or more, with US, European and Japanese shares seeing an average of 14 days. This is way above historical norms.
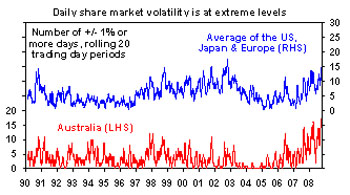
Source: Bloomberg, AMP Capital Investors
US economic rescue package and other policy moves
There is no doubt this crisis has turned out far worse than I, or most other investors, anticipated mid last year when it first started to blow up in a big way. Given the scale of the problems in credit markets and the threat these were posing to the broader economic outlook, it is clear a comprehensive solution was needed. Hence, we have seen the US Government’s relief program (now called TARP or Troubled Asset Relief Program). While a direct injection of capital into banks by the US Government may have been preferable, at least by removing bad debts from the banking system it should go a long way towards providing the necessary confidence for banks to deal with each other again and for them to be able to raise capital. As such, while not perfect and certainly not a panacea, the relief program should go a long way to removing the risk of a financial meltdown and hence a long and drawn out economic slump (or depression).
With the package failing to pass its first vote in the US House of Representatives, partly based on misconceived impressions that it was a bailout of Wall Street as opposed to a bailout of the broader economy, money, credit and share markets have simply gone back to factoring in some sort of meltdown. The gap between bank lending rates and short term government borrowing rates has now reached record levels and the gap between corporate borrowing rates and government borrowing rates has also blown out further. The likelihood is that some form of financial rescue package will be passed by Congress soon. The package has now passed the US Senate and with support for the relief package amongst ordinary Americans starting to grow it’s likely that the House of Representatives will vote in its favour soon.
Beyond the mayhem in the US Congress, authorities around the world are dealing pretty smartly with banking sector problems by expanding access to liquidity, providing loans to troubled banks, applying and expanding insurance protection for depositors and in some cases actually guaranteeing them. This is very different to the 1930s when over 5000 US banks failed, taking their depositors’ savings with them and driving the US into depression.
In addition to this, we think it is only a matter of time before we see interest rate cuts in the US, Europe, the UK, Japan and Asia. It’s quite possible that these will be coordinated. Locally, the Reserve Bank of Australia is likely to cut interest rate again next week, with a 0.5% reduction now probable given the deteriorating global economic backdrop, the impact of recent turmoil on local confidence, the ongoing constriction in global credit markets and the likelihood that the commercial banks won’t pass on the full amount of any rate cut given the latest blow-out in their funding costs.
The next year for shares
Of course in the very short term a lot is riding on the House of Representatives’ vote on the TARP. Successful approval by the US would be positive for markets. Conversely, if it fails altogether it will be taken badly. More fundamentally, while the US bank/economic rescue program should head off a long and deep recession or depression (providing reasonable prices are paid for the troubled debts) it won’t do anything about the economic deterioration already underway globally. The US, Europe, UK and Japan are all already on the brink of recession if not in it. China’s growth rate has already slowed from 12% last year to around 9%. The likelihood of more bad economic and profit news ahead, combined with the fact that October is often a rough month for shares indicates that further short term weakness in shares is possible.
But while the short term outlook is unclear, it is worth noting that the fall in shares from their highs is now pretty much in line with post 1960 bear markets in terms of magnitude. The next two tables show bear markets since 1960 for US and Australian shares.
Bear markets in US shares since 1960
|
Share bear market in US shares |
Mths to low
|
% fall |
Mths after low to make new high |
% gain in first 12 mths after low |
|
Aug 59-Oct 60 |
14 |
-13.9 |
3 |
+5 |
|
Dec 61-Jun 62 |
6 |
-28.0 |
15 |
+33 |
|
Feb 66-Oct 66 |
8 |
-22.2 |
6 |
+33 |
|
Nov 68-May 70 |
18 |
-36.1 |
22 |
+37 |
|
Jan 73-Oct 74 |
21 |
-48.2 |
69 |
+38 |
|
Nov 80-Aug 82 |
21 |
-27.1 |
3 |
+58 |
|
Aug 87-Dec 87 |
4 |
-33.5 |
19 |
+23 |
|
Mar 00-Oct 02 |
31 |
-49.1 |
55 |
+34 |
|
Average |
15 |
-32 |
24 |
+33 |
|
Oct 07- ? |
12 ? |
-29 ? |
? |
? |
Bear markets in Australian shares since 1960
|
Share bear market in Aust shares |
Mths to low
|
% fall |
Mths after low to make new high |
% gain in first 12 months after low |
|
Sep 60-Nov 60 |
2 |
-23.2 |
33 |
+12 |
|
Feb 64-Jun 65 |
16 |
-20.4 |
25 |
+9 |
|
Jan 70-Nov 71 |
22 |
-39.0 |
94 |
+52 |
|
Jan 73-Sep 74 |
20 |
-59.3 |
59 |
+51 |
|
Nov 80-Jul 82 |
32 |
-40.6 |
17 |
+39 |
|
Sep 87-Nov 87 |
2 |
-50.1 |
75 |
+35 |
|
Aug 89-Jan 91 |
15 |
-32.4 |
30 |
+39 |
|
Feb 94-Feb 95 |
12 |
-21.7 |
20 |
+25 |
|
Mar 02-Mar 03 |
12 |
-22.3 |
15 |
+27 |
|
Average |
15 |
-34 |
41 |
+32 |
|
Nov 07- ? |
11 ? |
-33 ? |
? |
? |
Since 1960, bear markets in US and Australian shares lasted an average of 15 months with an average top to bottom fall of 32% and 34% respectively. In the current bear market, shares have had top to bottom falls of 29% in the US and 33% in Australia, which is similar to bear market average declines. Given that a re-run of the 1970s economic calamity is unlikely and that we didn’t see the sort of share market overvaluation that preceded the 1987 crash or the bear market earlier this decade, there is good reason to believe we have seen the bulk of the damage. With shares now cheap, policy action to rectify the problems intensifying worldwide and investors now in panic mode (which is positive for shares from a contrarian perspective) there is good reason to believe shares will be up on a twelve month perspective.
Long term consequences
The first point to note is that the world is not about to end. While this has been predicted on numerous occasions in the past, such predictions have been premature and the same will apply this time around. I don’t plan to sell my house and all my shares or to head for the hills with a can of baked beans. However, the events we are now going through are historic in nature and will have a lasting impact on the financial world for years. The banking industry is being re-constructed in the US and elsewhere with mergers and the demise of investment banks. Political confidence in unfettered financial markets has now taken a hit and investor confidence in financial engineering and fancy investment products will take a long time to recover. As a result we are likely to be moving into a back to basics investment world with more financial market regulation, less leverage, less financial engineering and simpler products. One asset class that may be a long term beneficiary is traditional Government bonds which while offering low yields have proved their worth as a diversifier in tough times. It will also likely take many years for investor confidence to fully return.
Yes, there will be another asset bubble inflating in the next few years, but it is likely to be far away from the US (the source of the last two bubbles, i.e. technology shares and housing). Emerging countries with their ample capital are coming through this reasonably well and are a potential candidate for the next bubble, as are commodity markets.
Don’t panic
The well-known advocate of value investing, Benjamin Graham, coined the term “Mr Market” (in 1949) as a metaphor to explain the share market. Sometimes Mr Market sets sensible share prices based on economic and business developments. At other times he is emotionally unstable, swinging from years of euphoria to years of pessimism. But not only is Mr Market highly unstable, he is also highly seductive – sucking investors in during the good times with dreams of riches and spitting them out during the bad times when all hope seems lost. Over time share markets are driven by economic and business fundamentals. And the recent slump certainly does owe to fundamental economic problems associated initially with US sub-prime mortgage crisis. But the wild swings in the markets recently and the severity of the falls owe more to market sentiment which has now turned very negative. Joining the panic and selling out after 30% or so falls in shares will only turn a paper loss into a real loss. The trick for investors right now is to remain calm and look for the opportunities that the financial turmoil is throwing up. As Warren Buffett once observed, “be fearful when others are greedy and greedy only when others are fearful”, which perhaps explains why he is now buying into Goldman Sachs and General Electric even though investor fear is running high.
Dr Shane Oliver
Head of Investment Strategy and Chief Economist
AMP Capital Investors
Important note: While every care has been taken in the preparation of this document, AMP Capital Investors Limited (ABN 59 001 777 591) (AFSL 232497) makes no representation or warranty as to the accuracy or completeness of any statement in it including, without limitation, any forecasts. Past performance is not a reliable indicator of future performance. This document has been prepared for the purpose of providing general information, without taking account of any particular investor’s objectives, financial situation or needs. An investor should, before making any investment decisions, consider the appropriateness of the information in this document, and seek professional advice, having regard to the investor’s objectives, financial situation and needs. This document is solely for the use of the party to whom it is provided.