

The Indian growth story and opportunities for investors
Key points
- The Indian economy is likely to grow strongly over the decades ahead, eventually coming to rival China and having a huge impact on the global economy.
- India offers investors opportunities in shares, property and infrastructure that should not be ignored.
Introduction
The Indian economy has taken off in recent years. India is following a similar path to China and the rest of Asia, however there are some crucial differences. This note looks at the Indian growth story and the implications for investors.
Key drivers of Indian growth
Over the last five years, the Indian economy has grown by nearly 9% per annum (pa).
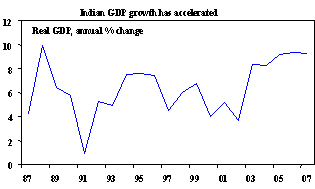
Source: Thomson Financial, AMP Capital Investors
India’s sustainable growth rate is now estimated to be around 7.5% to 8% pa supported by:
- The economic reforms of the 1990s, which deregulated the economy and opened it up to trade and investment
- High savings and investment rates
- India’s highly educated workforce
- Rapid urbanisation, coming from a low base
- Very strong growth in the services sector – particularly in IT and the financial sector
- Surging consumer demand
- Low per capita income – India is starting from a very low base and therefore has plenty of potential
Comparisons to China
The key drivers of Indian growth are very similar to China’s and the broader Asian growth story. This is most evident in a high and rising ratio of savings and investment relative to gross domestic product (GDP). However, there are several key differences.
India compared to China – key statistics
|
|
India |
China |
|
Population, now |
1.1 bn |
1.3 bn |
|
Population, 2050 |
1.6 bn |
1.4 bn |
|
Population growth, next 50 yrs, %pa |
0.8 |
0.1 |
|
Real GDP growth, last 5 years, %pa |
8.9 |
10.6 |
|
GDP growth, %pa, next 10 yrs, consensus |
7.5 |
8.6 |
|
Savings, %GDP |
33 |
45 |
|
Investment, %GDP |
34 |
43 |
|
Infrastructure spending, %GDP |
4 |
11 |
|
Manufacturing, %GDP |
15 |
44 |
|
Services, %GDP |
53 |
40 |
|
Agriculture, %GDP |
19 |
12 |
|
% Urbanisation |
29 |
43 |
|
Exports, %GDP |
14 |
41 |
|
Primary education completion rate, % |
81 |
98 |
|
Days to start a business |
89 |
41 |
|
Inflation rate, % |
5.5 |
6.9 |
|
Current account balance, %GDP |
-1.1 |
+11.4 |
|
Budget balance, %GDP |
-3.4 |
+0.2 |
Source: AMP Capital Investors
On the downside
India’s economic reform program began 15 years later than China’s, hence it is less advanced. India’s coalition politics and well-established democracy have meant slower progress. Compared with China, India has less savings to draw on, less urbanisation, a smaller manufacturing sector, a less developed export sector and a lower education rate. In addition, India is generally viewed as less “business friendly”. Privatisation has been slow, protection of domestic industries has been high and India’s labour market is less flexible. India also spends far less of GDP on infrastructure than China, which is evident in India’s generally poor infrastructure. For example, India has a lower highway density than China did 30 years ago.
As a result, India has tended to have less favourable macro indicators than China – lower growth, higher inflation and trade and budget deficits.
But stronger long term potential
India is not likely to grow as fast as China over the next decade, however its much higher reliance on the services sector rather than manufacturing suggests that it offers some diversification to investors in China. Its lower dependence on exports means it is less vulnerable to the global economic cycle than China. Corporate governance standards are high and India’s long established capital markets are far more efficient in terms of allocating capital around the economy than is the case in China.
India has a stronger long-term growth potential than China. China’s one child policy means that India’s population will surpass China’s within 30 years. Furthermore, India’s political future is more certain than China’s.
Implications for the global economy and Australia
Just over 300 years ago, China and India were the world’s biggest economies. With their high growth rates, they will again become the world’s top two economies in coming generations, so neither can be ignored.
.jpg)
Source: Angus Madison (2001, 2005), AMP Capital Investors
The growth of India has a number of implications for the global economy. Like China, India will become an increasingly important driver of global economic growth and commodity demand and its abundant cheap labour and cost advantages (already evident in the offshoring of service sector jobs to India) will see the country play an ever-increasing role in world trade, adding to downward pressure on global inflation. For example, the introduction of a US$2500 car in India, the Nano, will have a significant impact on the global car industry. In terms of commodity demand, the following table highlights the potential.
Annual commodity “consumption” per person
|
|
Copper (pounds) |
Aluminium (kilograms) |
Oil (barrels) |
|
US |
15.7 |
23.2 |
25.5 |
|
China |
5.7 |
5.5 |
2.0 |
|
India |
0.7 |
0.8 |
0.9 |
Source: Bank Credit Analyst, AMP Capital Investors
India’s commodity demand is only around 15% of China’s and its per capita consumption of various commodities is around ten years behind China’s. India’s lower reliance on manufacturing and lower infrastructure spending have restrained its commodity demand. However, India’s demand for key materials is likely to rise threefold over the next decade as investment increases dramatically (particularly in infrastructure) and living standards rise. An increase in India’s per capita oil usage just to China’s level would add an extra three million barrels per day (mbd) to global oil demand, in a world which is currently struggling to meet current oil demand of 86 mbd. Rising commodity demand in India will add to China’s demand, ensuring the continuation of the long-term super cycle in commodity prices.
India is now Australia’s seventh largest export market, but is likely to grow in importance. BHP has said that its growth of sales to India now outpaces sales growth to China.
Short-term issues
India has generally shown more signs of overheating than China, evidenced by its trade deficit and higher underlying inflation. This drove monetary tightening through 2005, 2006 and into early last year, contributing to concerns about the outlook for the Indian share market. But fortunately, with inflation stabilising recently and growth cooling slightly, interest rates are now likely to remain on hold before possibly falling over the next year.
Like other Asian currencies, the Indian currency - the Rupee - has faced upward pressure. Last year, authorities moved to restrict certain inflows, but this risked damaging India’s credibility. Fortunately, the Rupee has stabilised over the last three months, despite rising 12% last year against the US dollar.
Finally, as with most countries, there is the question of the impact of the US downturn on India. While it will no doubt act as a dampener on growth, India is less exposed than China and the rest of Asia (due to its lower export dependence) so it is unlikely to be significantly affected.
India for investors
India offers numerous opportunities for investors, particularly in infrastructure, property and shares.
The Indian share market has been booming for the last five years, rising at an average rate of 43% pa and making it one of the world’s strongest (Chinese shares have gained 39% pa). Given its relatively high services exposure and lower dependence on exports, Indian shares offer good diversification for investors in China. While Indian shares offer a very high return on equity, there are concerns that the Indian share market is overvalued – trading on a high price to earnings ratio (PE) and a low dividend yield.
Indian shares - high PEs but strong growth
|
Country |
Return on equity |
PE on 2008 earnings |
EPS grth, 08 & 09, % pa consensus |
PEG ratio |
|
China H |
19.5 |
17.3 |
22.6 |
0.8 |
|
China A |
16.9 |
31.9 |
25.9 |
1.2 |
|
HK |
16.5 |
17.3 |
12.5 |
1.4 |
|
India |
22.8 |
21.8 |
18.0 |
1.2 |
|
Korea |
13.3 |
11.6 |
15.1 |
0.8 |
|
Malaysia |
17.0 |
15.8 |
11.5 |
1.4 |
|
Singapore |
13.7 |
14.7 |
11.1 |
1.3 |
|
Taiwan |
16.8 |
10.9 |
11.6 |
0.9 |
|
Asia ex J |
16.2 |
15.1 |
16.1 |
0.9 |
|
Australia |
17.7 |
14.0 |
10.3 |
1.4 |
Source: Goldman Sachs, AMP Capital Investors
However, it is worth noting that this is justified to some degree by strong earnings growth in India. The ratio of the PE to expected earnings growth (or PEG ratio) suggests that Indian shares are not excessively overvalued.
Aside from short-term valuation issues and the higher volatility inherent in all emerging countries, India’s strong growth potential and high-quality, well-established corporate sector mean its share market offers investors a strong long-term return potential.
Conclusion
India’s growth potential is huge. Its large population will have a significant impact on the global economy. There is a strong case for long-term investors to have an exposure to India. Given the difficulty investors face in picking individual shares in India, the best way for most investors to gain such exposure would be via high-rated managed funds.
Dr Shane Oliver
Head of Investment Strategy and Chief Economist
AMP Capital Investors