

Where are we in the short and long-term share cycles?
Key points
- While there will be setbacks along the way, shares have most likely embarked on a short-term cyclical upswing that has further to run.
- Various structural constraints (including high debt levels and the need to reverse huge policy stimulus) mean that for US, European and Japanese shares this should be seen as a cyclical bull market in the context of a weak longer-term trend. We are also likely to see shorter, more volatile cycles going forward.
- Countries that do not face the same problems will be affected by the same short-term cyclical swings as US shares but against a far more positive trend. This includes Asian and most emerging market countries.
- Australian shares are somewhere in between.
Introduction
Since early March, shares have climbed a classic wall of worry with fears about everything from debt deflation to policy stimulus causing hyperinflation. However, an important issue is how any short-term cyclical rebound in shares will fit into the medium or longer-term trend.
Short-term cyclical recovery
The typical short-term investment cycle lasts around three to five years from trough to trough and tracks something like that shown in the next chart.
.bmp)
Source: AMP Capital Investors
During an economic downturn or recession, government bonds are the place to be. However, monetary and fiscal stimulus eventually start to sow the seeds of the next economic recovery. Shares normally anticipate this and start to move up about six months before the economic recovery occurs. This is the period in the cycle where shares climb the ’wall of worry’ as there is still uncertainty about whether there will be a recovery or not and how strong it may be. As a result, there may be a few setbacks along the way as uncertainty about the recovery resurfaces. This is probably where we are now. This eventually gives way to a ’sweet spot’ in the cycle where growth expectations are recovering, but inflation and interest rates are still low and stocks are cheap. After a few years, inflation starts to build and interest rates rise to onerous levels. This sets the scene for the start of the next cyclical downswing in shares which leads the next economic downturn. It is likely the current cycle will follow a similar trajectory. However, there are several points worth noting.
Firstly, while this cycle has been unusual in terms of the pressure to reduce high debt levels following sharp falls in asset prices, the unprecedented fiscal and monetary response has provided an offset, holding out the prospect of a ’normal’ cyclical recovery. The odds of which have been enhanced by signs that lower interest rates and fiscal stimulus have gained traction in terms of better economic data.
Secondly, past recoveries have often seen bond yields spike higher initially as investors start to factor in an economic recovery, inflation worries and monetary tightening. However, this usually proves to be premature as inflation tends to keep falling well into an economic recovery and central banks normally take longer to start tightening than first thought. This is likely to be the case at present, so the next six months may see bond yields fall back or stabilise after their recent spike. This should take pressure off mortgage rates.
Short-term worries about the impact of higher mortgage rates and oil prices, ongoing bank issues, capital raisings, rising unemployment and uncertainty about the strength of the recovery are all likely to make the ride for shares over the next few months more volatile than the last three months have been. The period from now to September/October is often rough for shares, so the current correction may have further to run. However, shares may have commenced a cyclical upswing and are likely to have more upside over the next year or two. Shares remain attractive compared to low yielding cash and bonds, most investors are still underweight shares and a further improvement in economic data is likely as we head towards an economic recovery from later this year.
The longer term secular picture
An important issue though is how the current cycle fits into the medium or longer-term trend for shares. In the 1970s and in Japan in the 1990s there were cyclical upswings and downswings. However, these were relatively short in duration and occurred in the context of below trend economic growth and a secular or long term bear market in shares. In this context it is worth noting that US and European shares have in fact been in a long-term or secular bear market since 2000 and Japanese shares have been in a long-term bear market since 1990. As can be seen in the chart below, the US share market has experienced several long-term bull and bear phases over the last century. The last secular bull market in US shares started in 1982 and ended in 2000 when the technology bubble burst.
.bmp)
Source: Thomson Financial, AMP Capital Investors
The key drivers of the 1982-2000 secular bull market included falls in inflation (which allowed shares to rise faster than earnings), easy credit, an increasingly stable macro economic environment, deregulation and smaller government, globalisation, the Information Technology (IT) revolution and favourable demographics. These considerations helped drive above average investment returns from 1982 on the back of strong profit growth and rising price to earnings multiples. For example, from 1982 to 2000 US shares returned 20% per annum (pa). For many countries this strength continued into 2007, e.g., Australian shares returned 16% pa over the 1982-2007 period which is well above long term average return of 12%. However, since the turn of the century many of these favourable themes have faded or gone into reverse, which is a dampener for share valuations and long term profit growth. In particular:
- The benefit to shares from the shift to low inflation over the last 25 years has run its course;
- The aftermath of the global financial crisis will likely ensure a tighter credit environment for the next decade or so, and still high gearing levels made worse by falls in house prices in the US provide a degree of vulnerability going forward;
- The need to unwind monetary and fiscal stimulus will likely contribute to a more volatile economic cycle. This will be a major issue in the coming years. To withdraw the stimulus too quickly runs the risk of a relapse as Japan saw in the 1990s. However, exiting too slowly could risk inflation and much higher bond yields;
- The policy pendulum is swinging back towards more regulation and greater government involvement in the economy. This could aversely affect economic dynamism and productivity growth; and
- Demographic trends are becoming less favourable as the proportion of the population at peak spending age decline and baby boomers retire. Poor population growth in Japan and Europe are additional constraints in these regions.
The bottom line is that while the recent low in shares provides good long-term opportunities for investors, when it comes to mainstream global shares the broad backdrop is not as positive as was the case at the start of the last secular bull market in 1982. In fact, the difficult fundamental backdrop today suggests that while we may have entered a cyclical recovery in shares, the medium term trend in US, European and Japanese shares is likely to remain weak and average medium term returns are likely to be around 5%-8% pa. The combination of high private sector debt ratios, pressure to reduce gearing levels and the need to unwind very easy monetary and fiscal policies will also likely result in a more volatile economic and financial cycle, similar to that experienced in the 1970s.
Investment implications
Firstly, investors should invest in markets which do not suffer to the same degree from high debt levels, demographic constraints, and exit problems associated with high public debt and very easy monetary conditions. Asian and emerging markets are generally high on the list on this front. It is worth noting that while US shares have been in a long term bear market since 2000, the trend in Asian shares has been strong. This is likely to continue. Due to Australia’s trade links to strong growth in Asia, better demographics and stronger public debt situation the medium term return from Australian shares may be somewhere in between the strong gains from Asian shares and the more constrained trend in the US.
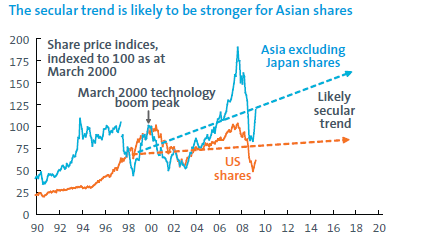
Source: Thomson Financial, AMP Capital Investors
Secondly, in a world of potentially big divergences in the return potential between asset classes and shorter more constrained investment cycles, asset allocation will likely be far more important than over the last 25 years when most asset classes had strong gains and asset allocation was less significant. Additionally, the macro economic environment will be more important for the management of equity, property and credit investment portfolios than has been the case in the recent past when recessions were mild and tended to be many years apart.
Conclusion
While there will be setbacks along the way, shares have most likely embarked on a cyclical upswing that has further to run. However, various structural constraints mean that for US, European and Japanese shares this should be seen as a cyclical bull market within an ongoing weak longer-term trend. We are also likely to see shorter, more volatile cycles. Investors should look to overweight countries that don’t face these same constraints. This includes Asian and most emerging markets and, to a lesser extent, Australian shares.
Dr Shane Oliver
Head of Investment Strategy and Chief Economist
AMP Capital Investors