

Putting negative investment returns in context
Key points
- Negative investment returns are disconcerting, but are a normal part of the cycle for diversified funds.
- Responding to negative returns by switching to cash will only lock in losses and produce lower returns over the long term.
- The best approach remains to adopt an appropriate long term investment strategy and to stick to it.
Introduction
The March quarter was the worst quarter on the Australian share market since the December quarter of 1987. After a rough five months, most superannuation funds are now recording negative returns on a 12-month ended basis and virtually all are in negative territory so far this financial year. This is naturally very disconcerting, particularly for those near to - or in - retirement for whom it’s not so easy to top up their funds and take advantage of lower share prices.
It’s made worse by all the confusing commentary floating around. I think that the global economic downturn is unlikely to be deep and long and that shares have seen the bulk of the damage and may have even seen the bottom and that either way they will be back onto a sustainable rising trend by later this year. But there are many out there who see a bear market stretching over several years on the back of the fallout from the US sub-prime crisis. In times of uncertainty like the present it’s useful to put prognosticating aside and put things into historical perspective.
Negative returns are not that unusual
The first thing to note is that periodic negative returns from a diversified mix of assets are not that unusual. What has been unusual has been the relative stability of returns over the period from March 2003 to mid 2007. The historical record indicates that traditional diversified portfolios of assets (cash, bonds, property and equities) have negative returns every six years or so. The next chart shows rolling annual returns for balanced and growth funds from the Mercer Investment Consulting survey since 1982. Since balanced funds only came into existence thirty years ago, the chart also shows a simulated balanced fund. This is constructed on the basis that an investor invests 70% in Australian equities and 25% in Australian bonds and five% in cash (i.e. bank bills). The chart excludes exposure to global assets and property because we do not have a long term monthly time series for aggregated global equities, bonds and property. In any case, investment in international assets was limited prior to the 1980s.
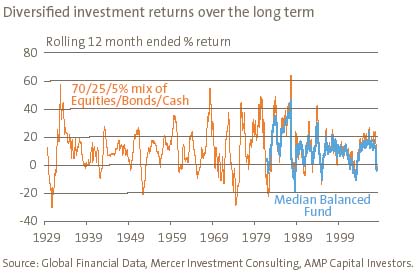
The simulated series tracks the Median Balanced Fund return pretty well, suggesting that it’s a good proxy. It’s clear from the chart that a period of negative returns every few years is a normal cyclical phenomenon. Negative returns occurred in 1930-31 (Great Depression), 1938-39 (recession), 1941-42 (World War II), 1949, 1952 (recession), 1956, 1960-61 (recession), 1964-65 (recession), 1970-71, 1973-74 (oil crisis, stagflation, Watergate, etc), 1981-82 (recession), 1987-88 (share market crash), 1990 (recession), 1994 (bond crash), 2001-03 (tech wreck, terrorist attacks). Equity market falls were a key factor in most of these episodes as were recessions.
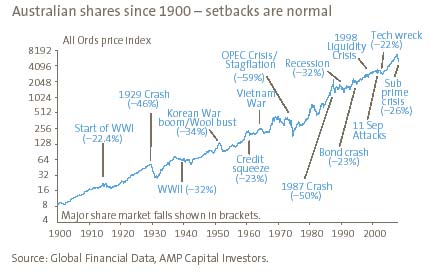
Unfortunately, with shares we have to take the bad (high volatility and periodic negative returns) with the good (higher long term returns than most asset classes). The chart below indicates that Australian shares have had numerous severe setbacks over the last 108 years. In the midst of many of these it seemed like the “worst ever” crisis, but the market has always recovered to resume its rising trend which equates to capital growth of 6.1% per annum (pa), or a total return of 12.4% pa when dividends are added in.
Mean reversion
The poor returns of the last few months may be seen as payback after the much stronger than expected double digit returns of the 2003 to 2007 period. The following table provides a comparison of “balanced fund” returns over the last few years with those that would have been implied by asset class returns over the last century or so.
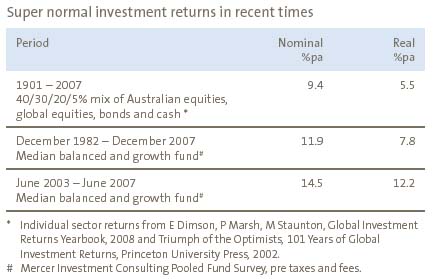
The 2003 to 2007 period and indeed the last 25 years have seen returns run way above what appears to be sustainable on the basis of returns over the last century or so. The key drivers have been the shift from high inflation to low inflation which boosted equity and bond returns in the 1980s and 1990s; the “chase for yield” over the last five years which pushed down yields on other assets; and unsustainably strong profit growth. All of these drivers have probably now run their course, suggesting lower returns ahead in the absence of a new asset bubble.
While most fund managers, me included, didn’t see a violent and sudden bear market, most did see a return to more sustainable and more modest returns at some point, after the strong gains of the 2003 to 2007 period.
The trick for investors is to hold the course
After suffering a loss, the temptation is to switch to a more conservative strategy. While this might make getting a good night’s sleep easier, over the long term it invariably results in lower returns. The following chart shows the cumulative return to two portfolios since July 1928:
- a fixed balanced mix of 70% Australian equities, 25% bonds and five% cash;
- a portfolio which starts off with the above mix but which moves 100% into cash after any negative financial year and doesn't move back until after the balanced portfolio generates one financial year of positive returns (assuming an investor who switches to cash after a down year will require a year of positive returns to get confident again). We have assumed a two-month lag. This is called the “switching portfolio”.
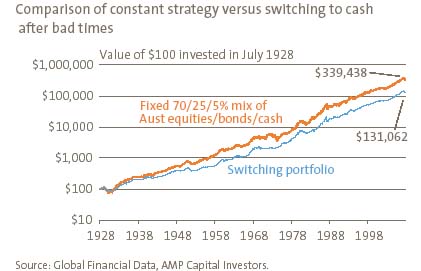
The switching strategy does produce better short-term results when there were two consecutive financial years of negative returns from the fixed balanced mix as in the early 1930s, mid 1970s and earlier this decade. However, over the long run it produces an average return of 9.4% pa versus 10.7% pa for the balanced fund. This compares to returns of 5.4% pa for cash, 6.9% pa for bonds and 12.1% pa for equities. On a $100 investment in 1928 the switching portfolio would have grown to $131,062 by March 2008 compared to $339,438 for the constant balanced mix. The conclusion is clear – switching to cash after a bad year is not the best strategy for maximising wealth over time.
Psychology through the cycle
One of the key ingredients for successful investing is for an investor to be aware of how their psychology is being affected by movements in investment markets to which they are exposed. Typically, investor psychology through the course of a market cycle looks something like this.
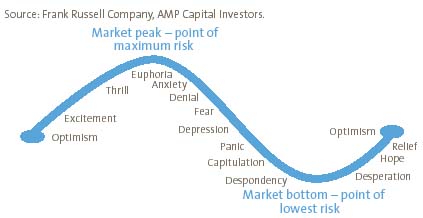
Investors tend to be “euphoric” at the top of a market cycle after a period of strong gains, and tend to be “despondent” at the bottom after a period of strong falls. This results in buying at the top when the risk of a fall is greatest and selling (or “capitulating”) at the bottom when in reality the opportunities for capital gain are at their greatest. Of course, it’s never quite as mechanical as the above chart implies. But the key point is that investors need to be aware of their psychology and how it’s influencing their decisions and to resist being driven by it if they wish to maximise their wealth over the long term. The best way to make money is to buy when everyone else is capitulating and despondent (or to put it more graphically there is “blood on the streets”) and to sell when everyone else is “euphoric”. Given the difficulties in timing though, for most investors the ideal approach is to adopt an appropriate long term investment strategy and stick to it.
Conclusion
No one likes to see their investment portfolio fall in value. Unfortunately though, occasional bouts of negative returns are the price we have to pay for accessing the higher returns that growth assets like shares provide over time. While switching to cash may make sleeping at night easier after - and during - periods of market weakness, it’s likely to ensure lower returns over the long term. The key for investors is not to be thrown off their long term strategy by periodic calamities.
Dr Shane Oliver, Head of Investment Strategy and Chief Economist
AMP Capital Investors